Kyle Loomis · July 3, 2024

In the last few posts, we covered how spotlight helps buyers and sellers analyze markets, optimize pricing, and generate trading ideas for OTC derivatives. Let’s dive deeper into the Spotlight platform and show how our tools aid in market analysis.
Spotlight controls every step of the data process, including sourcing, transforming, and unmasking data, as well as providing custom-built tools to filter and aggregate the data. We believe that telling the story behind every trade is vital to gaining an edge in sales and trading, which is why we work closely with our clients to build powerful analytical tools.
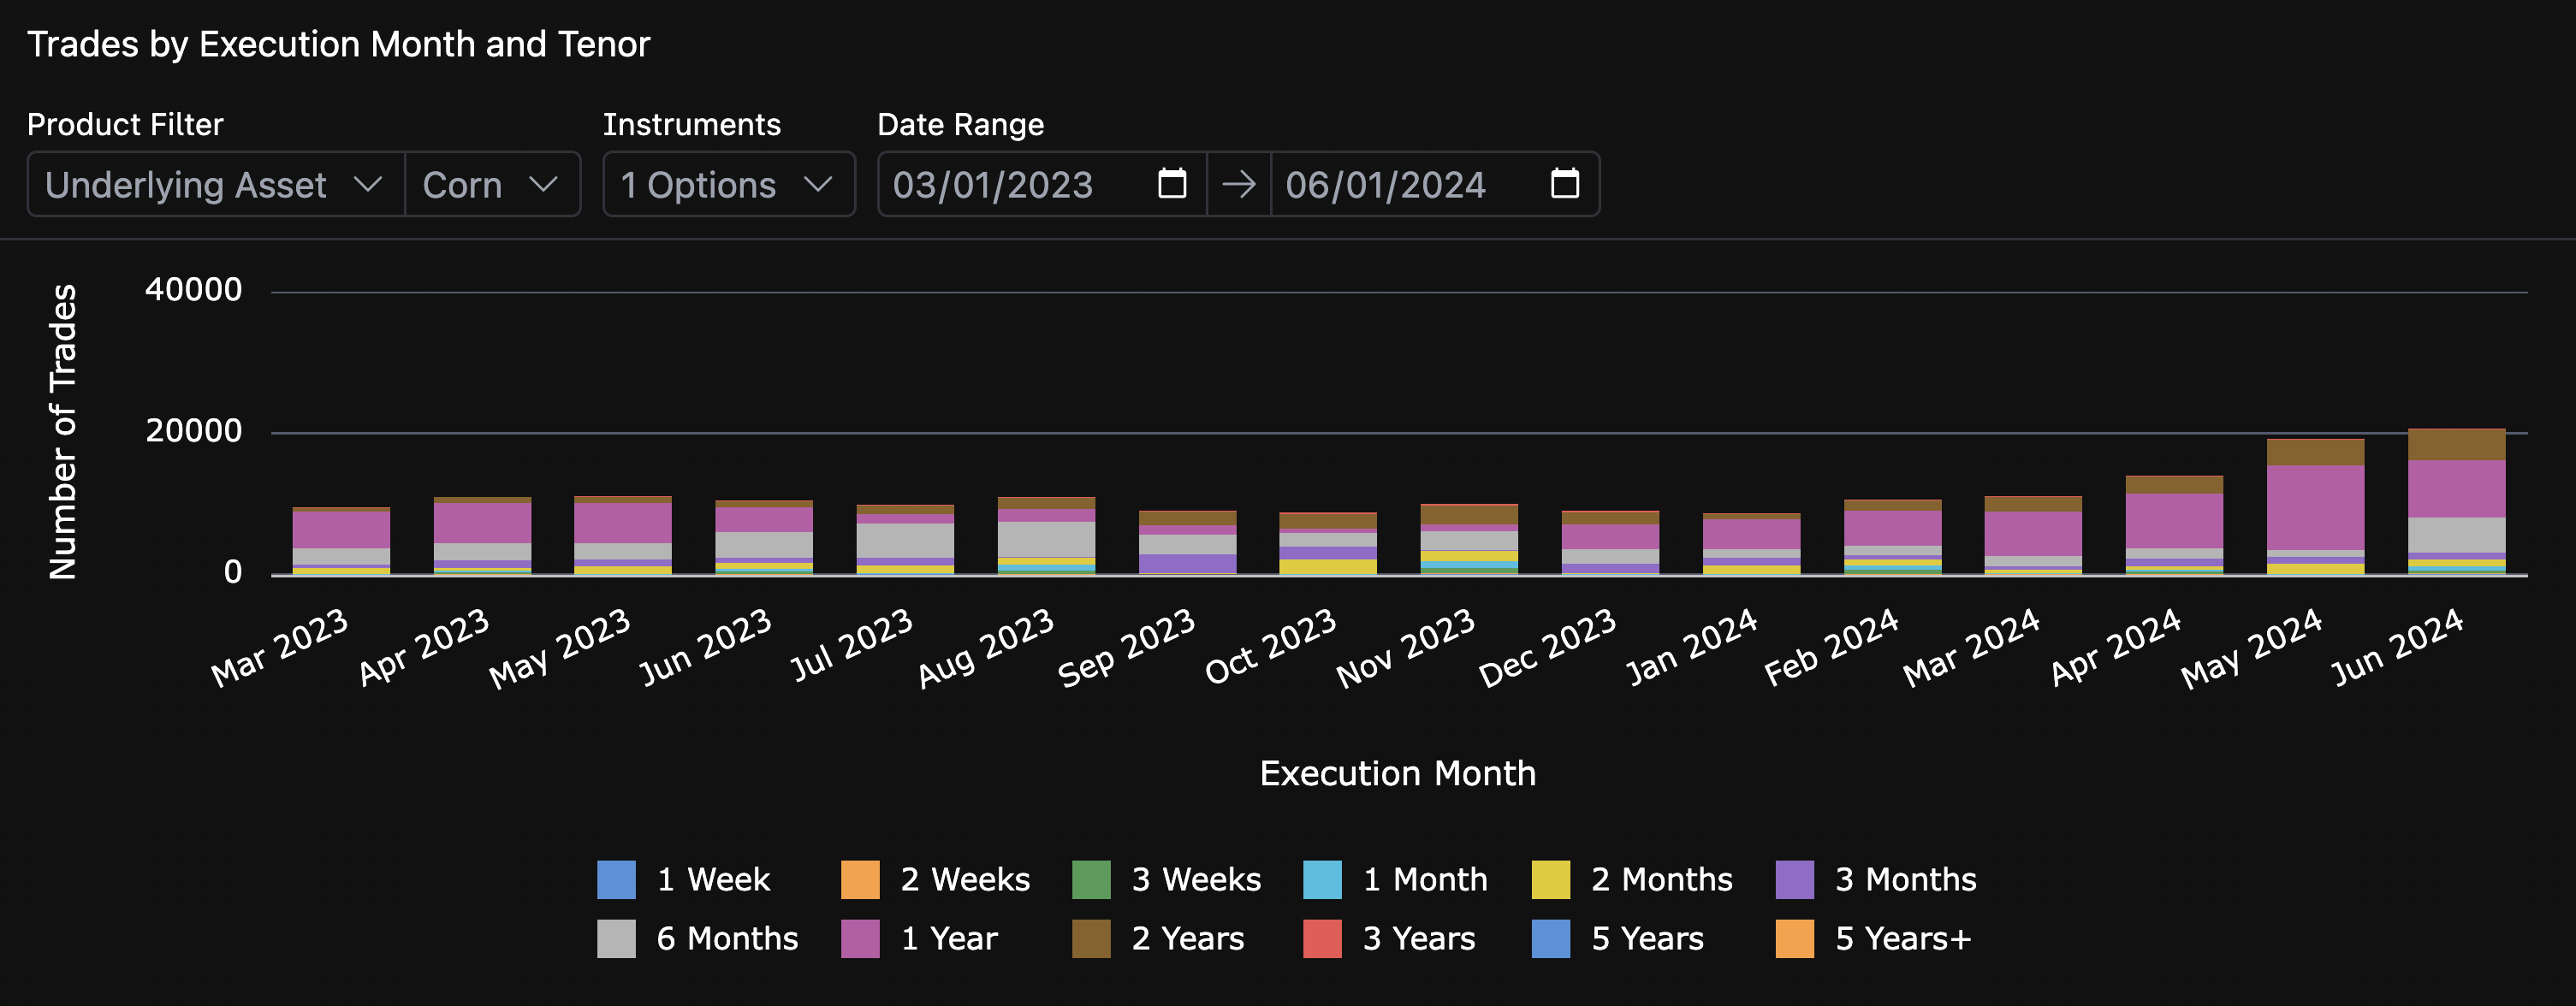
A core part of our Spotlight application is the Reports page. Our reporting functionality gives users the ability to drill down into specific markets to understand how and why the OTC landscape is changing. We recently published a pre-canned chart which shows the number of trades by execution month and tenor. This chart helps users understand the seasonality in hedging activity for specific markets.
To use this chart, start by filtering on product, sub-product or underlying asset to zoom into a specific market. Next, select relevant instruments, and finally choose a suitable date range. The chart below filters on corn swaps traded over the past year.
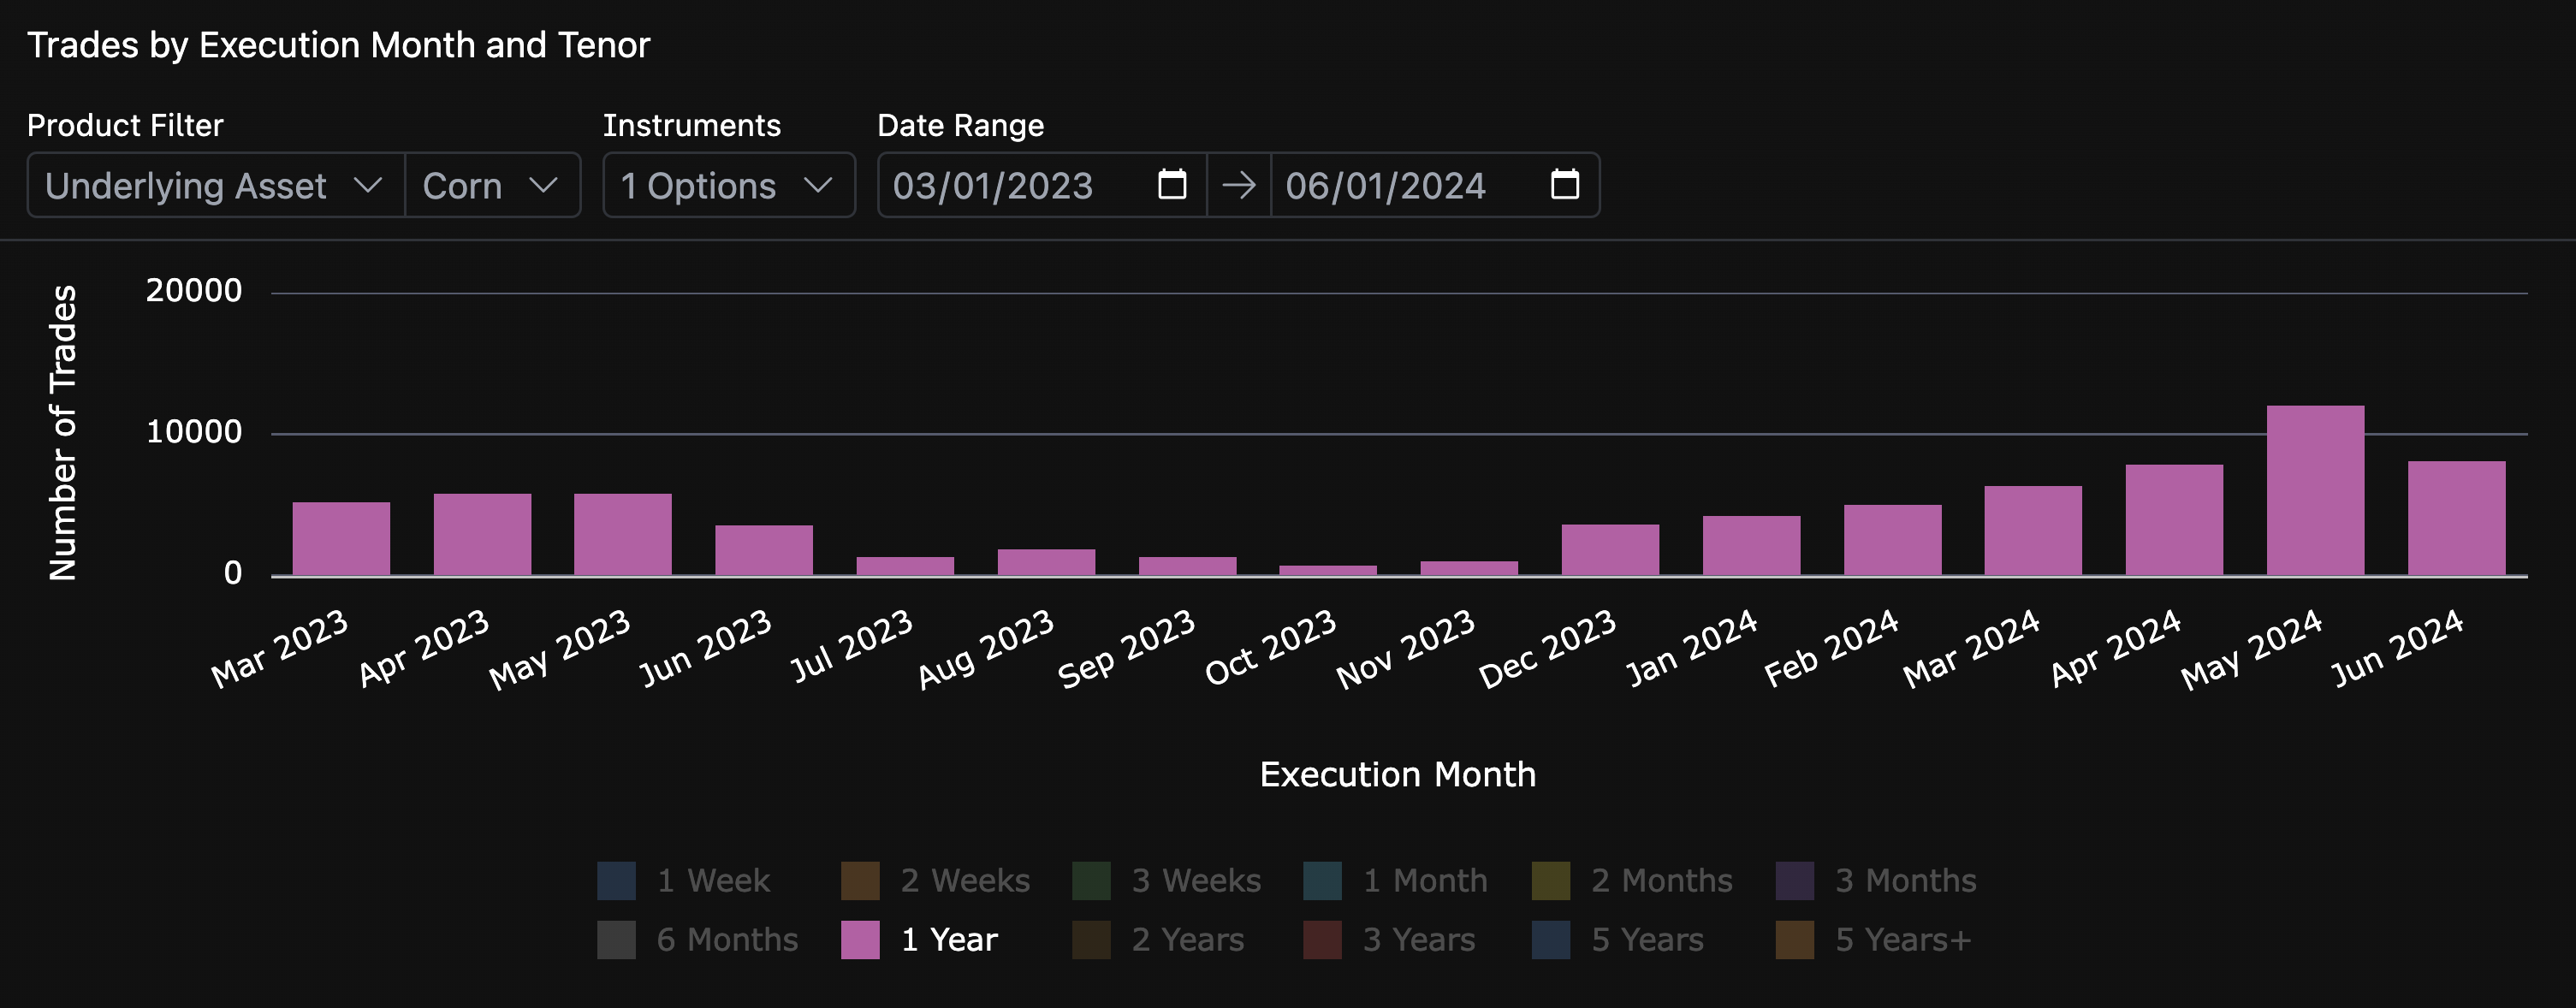
By selecting instrument tenor equal to 1 year, you can start to see the seasonality of hedging activity in corn markets, showing that hedging picks up around the planting season during April through June.
Spotlight is working closely with market leaders to build the best platform for analyzing the OTC derivatives market. Join Spotlight in reshaping the future of the OTC derivatives market.