Kyle Loomis · October 17, 2024

I have come across dozens of options analysis tools. While some offer unique functionality, they all have one thing in common – they all rely on exchange-traded data to power them.
At Spotlight, we’re experts at converting messy data into useful insights. We recently leveraged our uncleared OTC derivatives data to create a one-of-a-kind analysis for OTC options.
One of the biggest challenges of options analysis is figuring out where money and risk is placed. Looking at the distribution of option premium over expirations and strikes provides valuable insight into where dealers and their clients are placing hedges and bets.
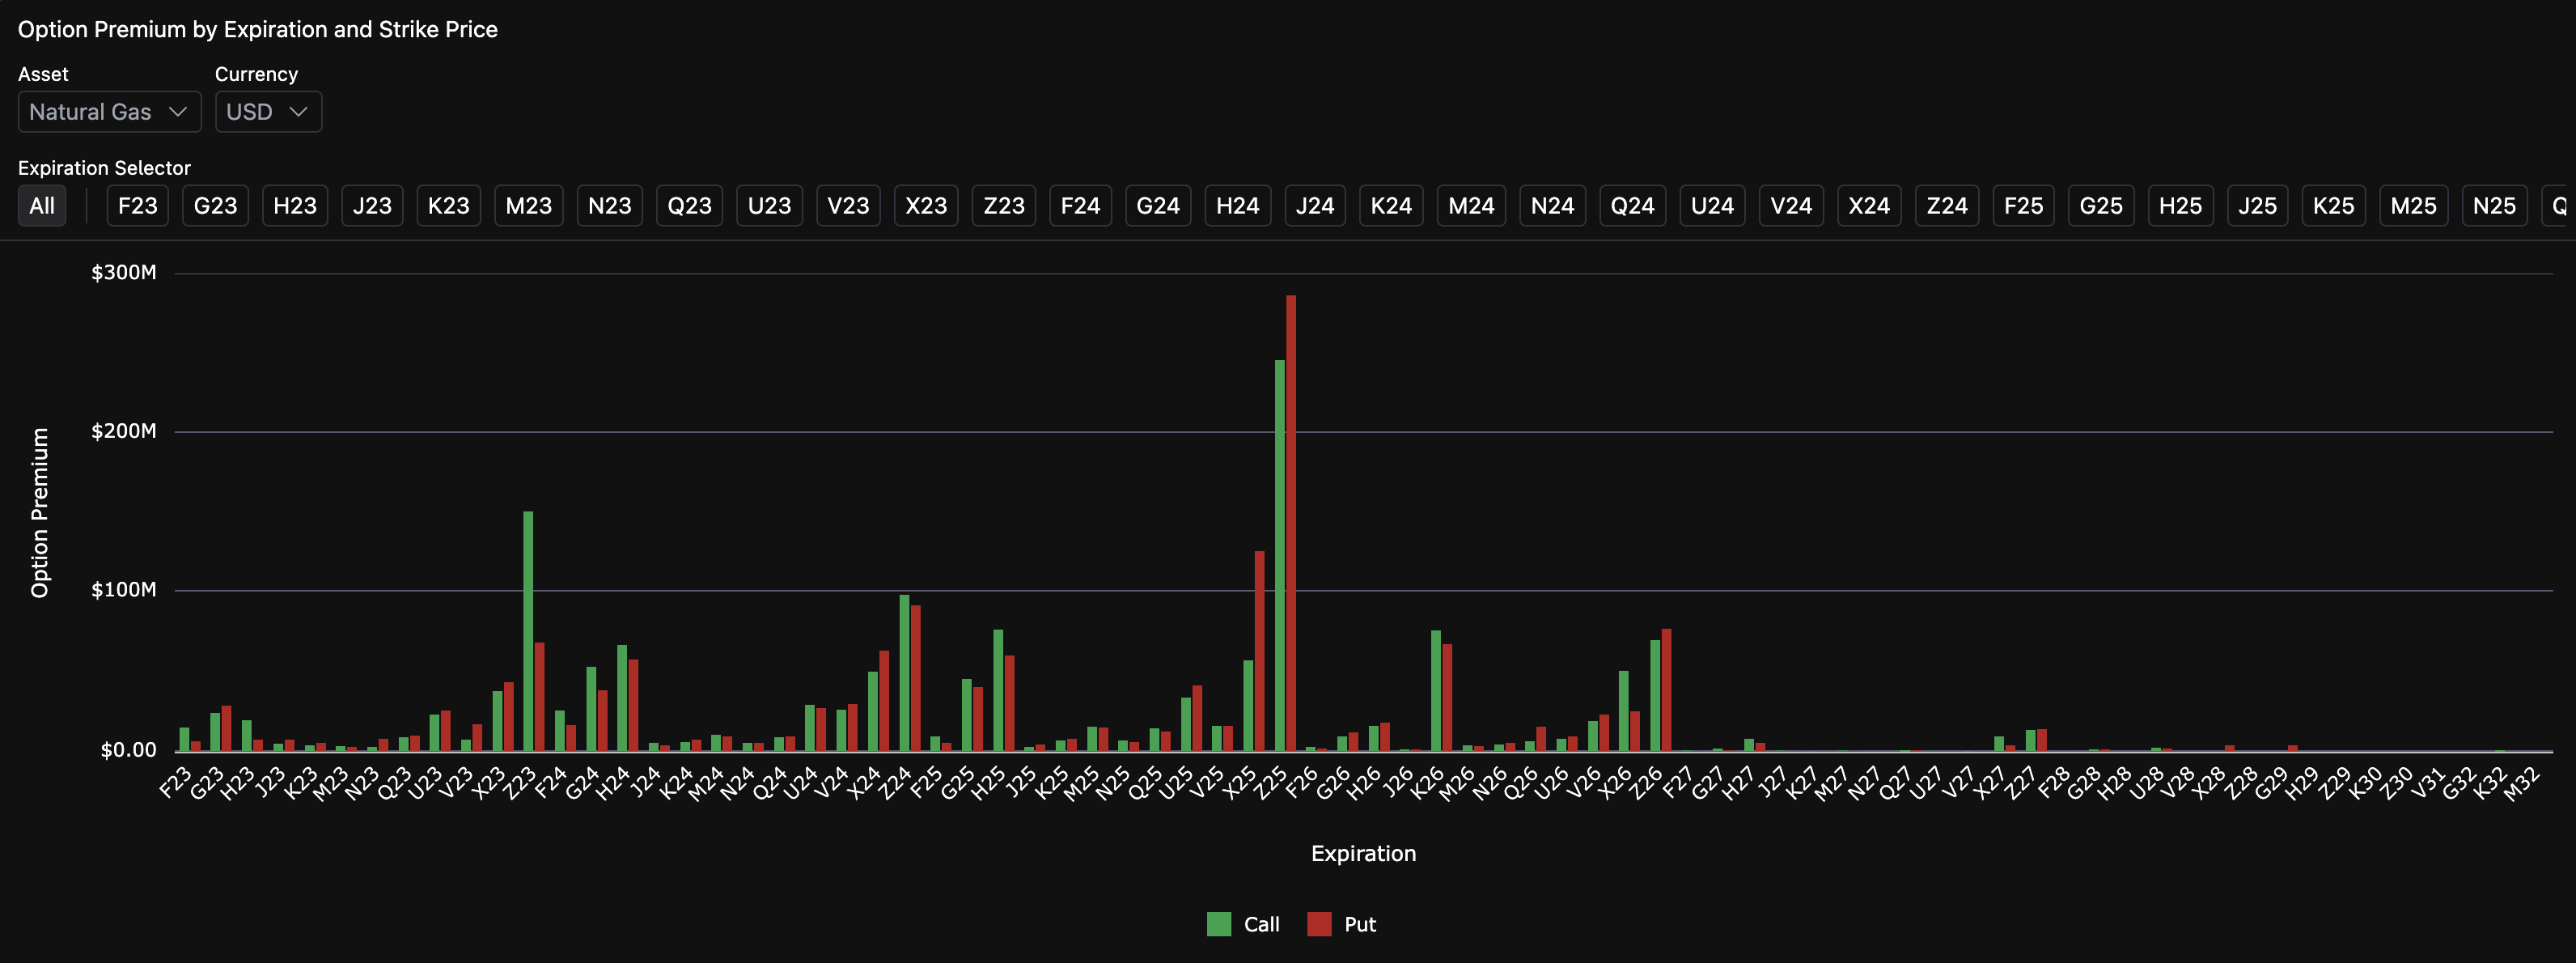
We start by selecting an initial asset, in this case Natural Gas, to see a simple chart of the total option premium of Puts vs Calls broken down by Expiration. This chart shows us the hottest expiration months, and gives us a clear visual cue into outsized premium for the December contracts (e.g. Z24).
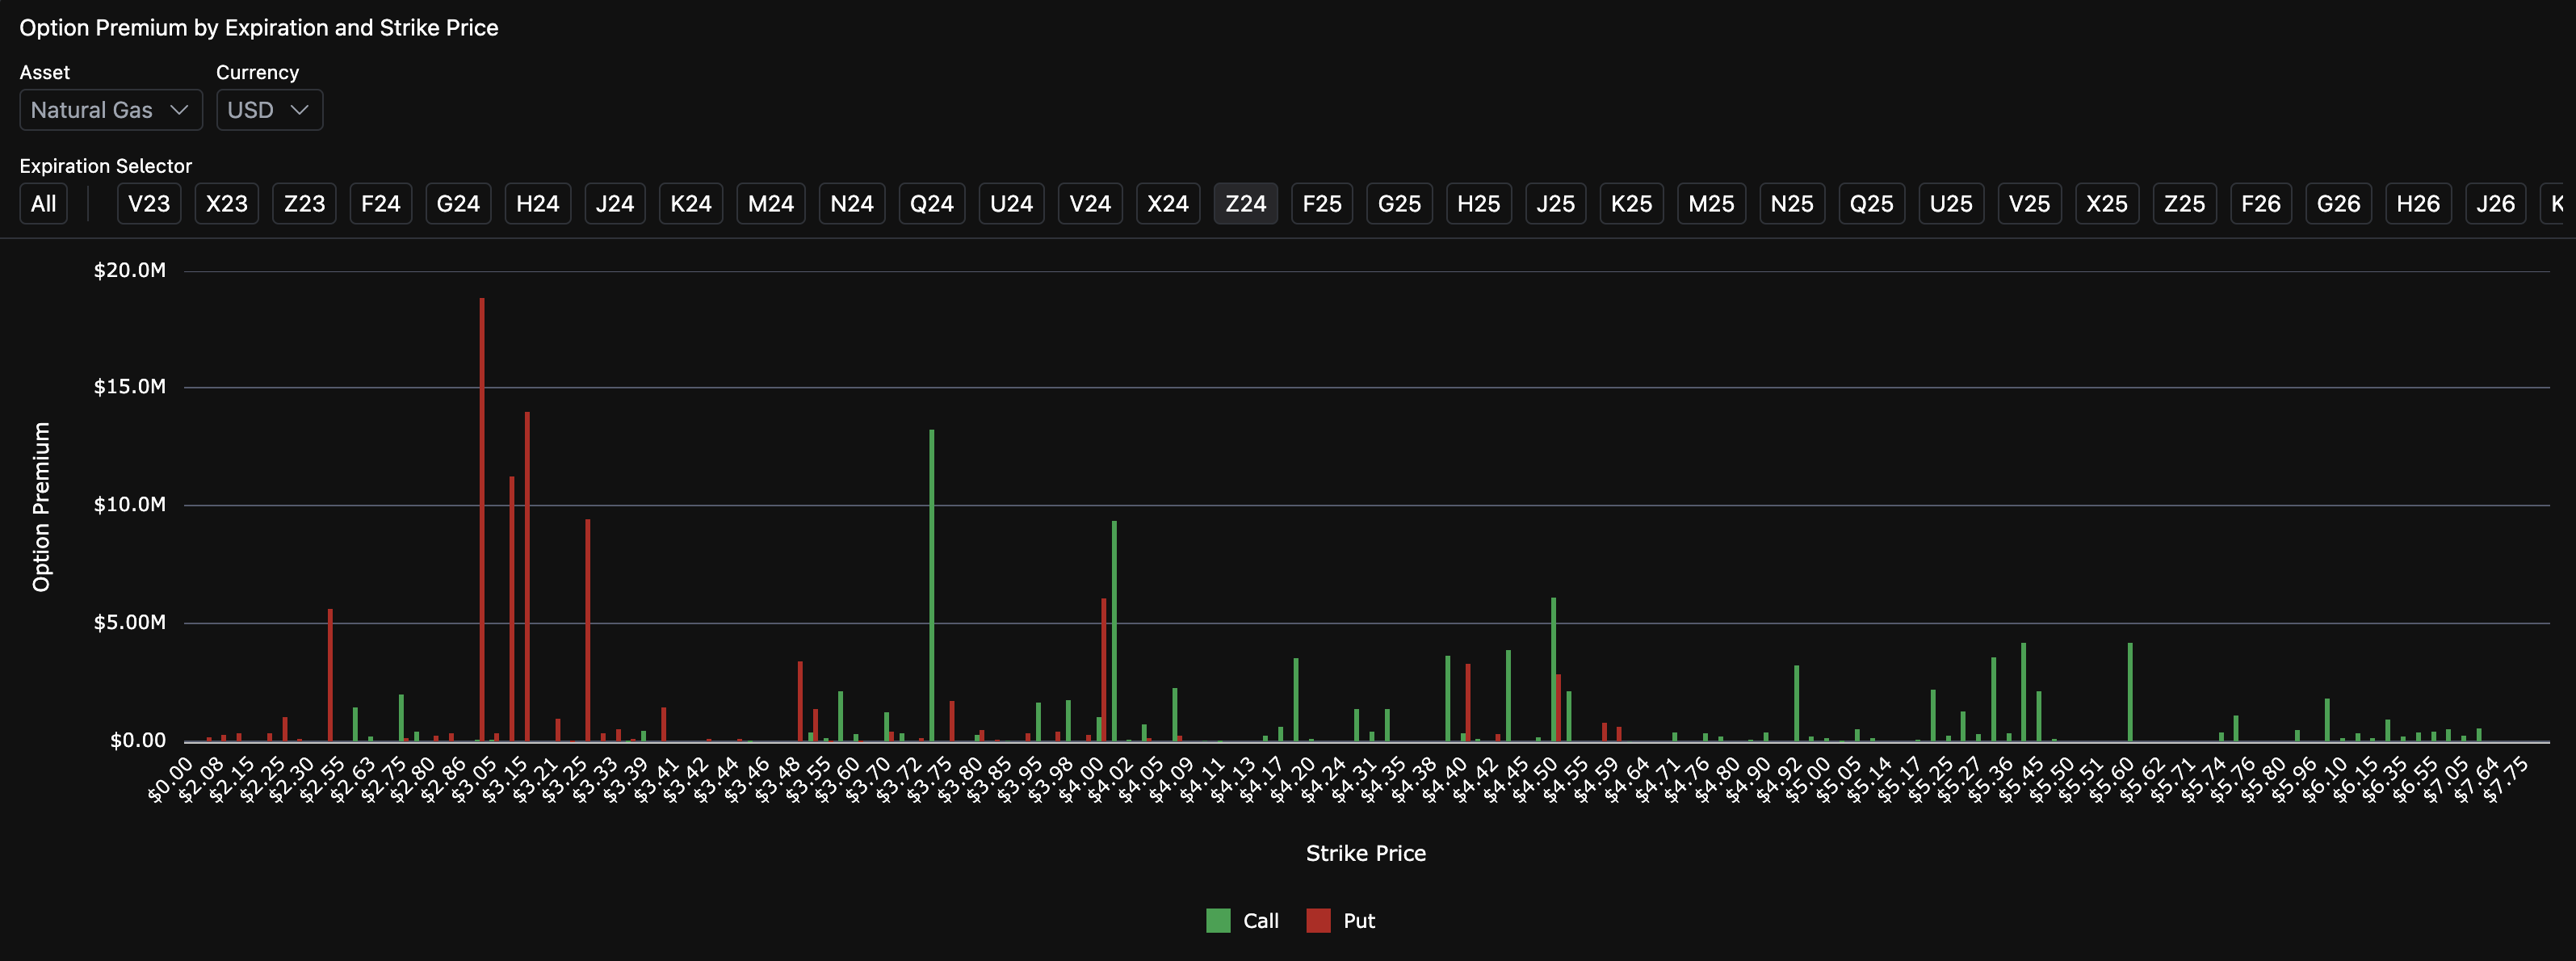
Next, we can zoom in on any expiration date to get a granular view of the premium by strike price. Looking at the December 2024 (Z24) contracts, we see that there is a massive put activity ($18.9M total premium) on the $3.00 strike put. Note that since these contracts are traded OTC, there is less standardization which is why we see a larger distribution of strike prices, including odd numbers such as $3.21.
This analysis is just the tip of the iceberg for what Spotlight covers in the OTC derivatives market. Request a demo of Spotlight if you’re interested in learning how Spotlight could reveal unusual activities in your workflows.